![]() For some reason, when I think of reverse execution and debugging, the sound track that goes through my head is a UK novelty hit from 1987, “Star Trekkin” by the Firm. It contains the memorable line “we’re only going forward ’cause we can’t find reverse“. To me, that sums up the history of reverse debugging nicely. The only reason we are not all using it every day is that practical reverse debugging has not been available until quite recently. However, in the past ten years, I think we can say that software development has indeed found reverse. It took a while to get there, however. This is the first of a series of blog posts that will try to cover some of the history of reverse debugging. The text turned out to be so long that I had to break it up to make each post usefully short. Part two is about research, and part three about products.
For some reason, when I think of reverse execution and debugging, the sound track that goes through my head is a UK novelty hit from 1987, “Star Trekkin” by the Firm. It contains the memorable line “we’re only going forward ’cause we can’t find reverse“. To me, that sums up the history of reverse debugging nicely. The only reason we are not all using it every day is that practical reverse debugging has not been available until quite recently. However, in the past ten years, I think we can say that software development has indeed found reverse. It took a while to get there, however. This is the first of a series of blog posts that will try to cover some of the history of reverse debugging. The text turned out to be so long that I had to break it up to make each post usefully short. Part two is about research, and part three about products.
Let’s start with background and definitions.
To me, the key defining factor of reverse debugging is the ability to apply breakpoints in reverse – essentially, to be able to go to the previous occurence of a breakpoint just as well as going to the next. The implementation allowing this might vary.
The contrast to reverse debugging is classic cyclic debugging where you run and rerun a program with a problem, looking at variables and setting breakpoints during each run to zoom in on an issue. For cyclic debugging to work, you pretty much require each run to behave the same way. The program has to be fundamentally deterministic. This is
usually the case for non-interactive single-threaded programs, but not the case for real-time programs, parallel programs, or programs that involve some kind of asynchronous input/output (reading and writing files is a special case of IO that can indeed be deterministic since there is usually no interference from the environment in those operations).
Thus, for non-deterministic programs and rare errors, reverse debug is what you want. Run once, hit the error, reverse to diagnose it.
In addition to reverse debug and cyclic debug, we also have record-replay debug. In such a system, you record an execution and later replay it forward. Debugging is strictly forward: you cannot step back in time instruction by instruction, nor trigger breakpoints backwards in time. Record-replay debug is a way to allow cyclic debugging on non-deterministic highly variable program runs. This can be implemented with a lot less debugger complexity than a true reverse debugger, even if the underlying runtime system is almost identical to reverse debugging.
So, how do you implement reverse debugging?
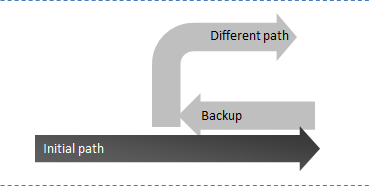
Reverse execution is one way to implement reverse debug. In reverse execution, the execution system has the ability to move backwards in time and put the entire system in the state it was in at some previous point in time. You can step the system back instruction by instruction or cycle by cycle. You can also continue the execution
forward from any point in time, throwing away the history of asynchronous inputs to actually take a new execution path.
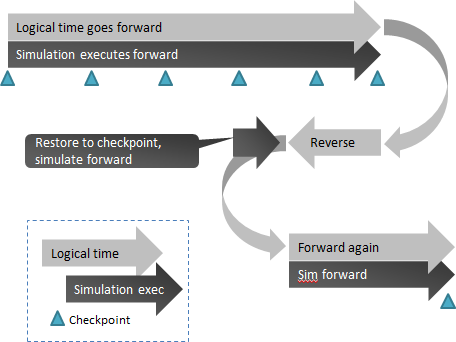
Typically, reverse execution is implemented by using checkpoints of previous system states plus a deterministic way to re-execute the system from those checkpoints. The key technical problems to be solved is how to checkpoint the system and how to make re-execution deterministic (note that determinism does not imply invariant or predictable behavior, just that you can reliable recreate a particular execution). You also need to record and replay anything that you cannot re-execute, such as user interactions or network communications with the world outside the controlled system.
Schematically, it works like this, note how simulation time always moves forward even though the logical system time sometimes moves backwards:
Record-replay debug is usually implemented in a way similar to this, without the ability to go back in time and usually without the intermediate checkpoints.
Trace-based debugging is based on recording everything a system does into a trace, and once the recording is done, debugger works on the trace rather than using the log to drive an actual system. Reverse debug is implemented by recreating the state of a system by reading the trace, and finding points in the trace where breakpoint conditions are true. This is also known as post-mortem debug, since you debug after the target system has finished executing (typically). A log can be captured by a hardware device, or by software being instrumented to log everything that is going on. The technology can also be used to implement record-replay debugging.
There are some other important distinctions between different approaches to reverse debugging that we need to keep in mind as we review the history of the field.
- System or user-level? Do you debug a system, including the OS, or just a user-level application running on top of the operating system? User-level debug can often be solved in simpler ways than system-level debug, but also suffers from some limitations. There are also times where system-level is simpler.
- Single-threaded or multi-threaded? Can you debug multiple threads, processes, processors, or just a single processor or user-level thread? A single thread of control greatly simplifies the problem.
- Cross-target or host-based? Do you debug programs running on the same host as the debugger, or can it also target remote targets or cross targets (such as embedded systems)?
- Instrumented or unchanged programs? Quite a few solutions for reverse debug tried over the years involve compiling programs in a special way, using instrumented OS libraries, or other implementation variants where the program debugged is not identical to the eventual deployed program.
Given this background, the next post will cover early research, and the third post the beginning of commercial products.
Note that on Stack Overflow, reverse debug does not seem to be particularly big thing still. The reverse-debugging tag has all of 10 members, while other topics like C# and Android programming has millions… so maybe reverse is not quite mainstream yet. Or maybe it is just the case that Stack Overflow has more web-style developers than low-level developers in their membership.


Reverse debugging just isn’t practical. At least with GDB, it’s very slow, limited in functionality, and buggy. I use checkpointing all the time though.
@balor123
I think it can be very practical – the gdb implementation isn’t particularly fast or optimized, but that is just one implementation among many. Some are way faster.
What kind of checkpointing were you referring to?
Hello,
First of all, thank you for all the insight in Reverse DB, these are very useful links for anyone who is working in DB.
I would like to comment on the comparison you made between record-replay and reverse/cycle.
From my point of view record-replay is quite orthogonal comparing to reverse/cycle. Probably it would be a good practice to use both R&R and Reverse debug: the maintenance team can use R&R to obtain a “replayable” log of the failure-inducing execution that occurred in the user’s machine and then use a reverse-debugger to do the actual debugging.
There are two levels here:
* If you record and replay individual instructions, it is a clear alternative to re-execution-based reverse execution.
* If you record and replay higher-level events, to later replay them on a different machine to reproduce a scenario, you have a very useful tool. Indeed, we implemented that workflow in Simics 4.8. We let users record asynchronous inputs on one machine, and then take the recording to a developer machine where reverse execution is then applied using the recording to first reproduce the original run from sparse data.
The openMSX emulator has a reverse feature and debugger with in which you can do reverse debugging.
I use it all the time for my Z80 project, it’s the best. I have a breakpoint set to trigger when I hit an assertion, and from there I can simply step backwards to look for the origin of the problem, often in no time at all.
Thank you for the tip! Indeed, OpenMSX has apparently had this since 2010, and it looks like a replay-recreate approach where inputs are recorded. Nice job. That also means the emulator has to be deterministic. I like the dual-use of this for both debugging why things go bad and to let a player cheat by undoing mistaken game actions.
(Sorry to respond to an older post but I’ve just found “A Review of Reverse Debugging”.)
IMO, the traditional approach to debugging is very low-level in terms of capabilities. I have dreamed since the 80s about a debugger that allowed you to examine state in time (as usual) and gave you just one other important feature for control of execution: select a value (variable and value in current state) and click Regress, that would take you back to the line of code, and state, that set that value.
Debugging is essentially a reverse-time process of examining code and its inputs and tracking backward along bad inputs until you reach bad code. A simplification perhaps but a debugger built with this focus would be revolutionary.
My preferred method for implementing this would be a combination of trip counters (inserted into basic blocks) and watchpoints. (It would need to be smart about lifetimes of data structures on the heap.)
A debugger like this would be intuitive to use and attract more mainstream enthusiasm?